Analyzing Results
When you open Autonomous, the Home Page is displayed with a summary of all test runs.
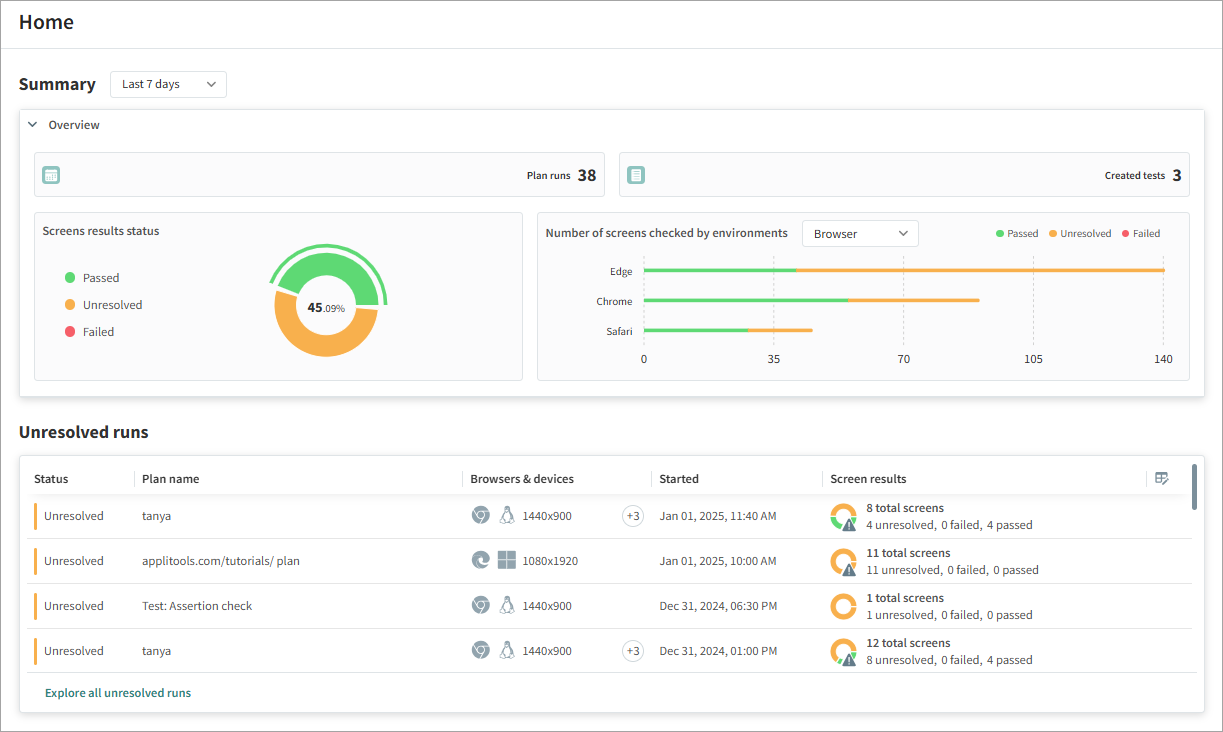
Summary Charts
The summary charts at the top of the Home screen provide an overview of tests that have run recently. You can select the time period for the displayed statistics:
- Today
- Last 7 days
- Last 30 days
- Last 90 days
This section shows cards with the following statistics:
- Plan runs
- Created tests
- Percentage of screens passed
- Number of screens checked
Click on any of the cards to view details.
The Summary area includes a pie chart and a bar graph with a breakdown of the status of tests in the selected period. Click on a chart to view a more detailed view
Unresolved Runs
The lower part of the window has links to recent test runs that are unresolved. A test is marked as unresolved if there is a difference that needs to be reviewed and approved or rejected.
Click on a row to view details of the result.